I have a ‘go-to’ list of quality and up-to-date sources of information that I continuously draw upon either as a reference, for training, detecting patterns and trends, or comparison and evaluation.
The list covers Python and R environments, two common programming languages supporting a plethora of libraries used to solve data science problems.
The following graph provides an outline of the data science process and the skills and knowledge required to practice it.
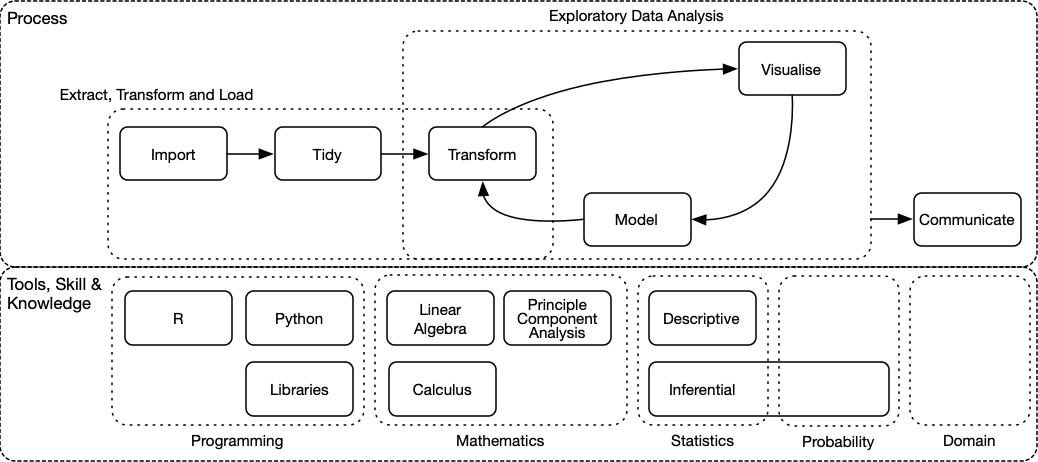
The data science process and tools, skills & knowledge that support it
The process section of the graph is an extract from R for Data Science by Hadley Wickham and Garrett Grolemund.
Summary of the data-science process
Data analysis is the process by which data becomes understanding, knowledge and insight. Hadley Wickham, July 2013
Extract, Transform & Load
The first, and probably the most labour intensive part of the data science process is to prepare and structure datasets to facilitate analysis, specifically importing, tidying and cleaning data. Hadley Wickham wrote about it in The Journal of Statistical Software, vol. 59, 2014.
Tidy Data
Tidying data1 aims to achieve the following:
- Each variable2 forms a column and contains values3
- Each observation4 forms a row.
- Each type of observational unit forms a table.
It attempts to deal with ‘messy data’, including the following issues:
- Column headers are values, not variable names.
- Multiple variables are stored in one column.
- Variables are stored in both rows and columns.
- Multiple types of observational units are stored in the same table.
- A single observational unit is stored in multiple tables.
Null Values/ Missing Data
Most models are typically unable to support data with missing values. The data science process will, therefore, include steps to detect and populate missing data.
It can occur anywhere between the importing and transforming stages. Models can be used to guess values for more complex treatments, whereas a more straightforward approach could use aggregation during transformation.
Transform
The result of the transform step in the data science process is to:
- reshape data, which could be used to produce tidy data,
- transform data, like rescaling5 of numeric values, or reducing dimensions of categorical values using Principle Component Analysis
- create new features, also known as ‘Feature Engineering’,
- or a combination of the above that typically results in aggregation.
Split, Apply, Combine
A typical analytical pattern is to:
- split, group or nest data into pieces,
- apply some function to each piece,
- and to combine the results back together again.
It is also a useful approach when modelling. Read more about it in Hadley Wickham’s paper: ‘The Split-Apply-Combine Strategy for Data Analysis’.
Visualisation & Modelling
Visualisation and Modelling is used to detect patterns in data.
In Feburary 2013 Hadley Wickham gave a talk where he described the interaction between visualisation and modelling very well.
Visualisation can surprise you, but it doesn’t scale well. Modelling scales well, but it can’t surprise you.
Visualisation can show you something in your data that you didn’t expect. But some things are hard to see, and visualisation is a slow, human process.
Modelling might tell you something slightly unexpected, but your choice of model restricts what you’re going to find once you’ve fit it.
So you iterate. Visualisation suggests a model, and then you use your model to factor out some feature of the data. Then you visualise again.
Communicate
The result and product of the data science process is to communicate findings, typically to non-technical and busy recipients. It is the most important deliverable of the process, even if not the first thing that springs to mind when considering data science. Fantastic insights are of no use if the intended audience doesn’t understand or trust it. It is therefore vital to take care when presenting findings.
Visualisation is a significant deliverable.
Visualisation is an essential ingredient of communication. It summarises and simplifies information, with the following guidelines applying:
- Intuitive and straightforward with a low learning curve (KISS)
- Focus on the salient points, keeping noise | clutter to a minimum
- Content is explicit and not implicit
- Promoting shared understanding, including producing underlying information supporting layered and increasing levels of detail and complexity to align operations and various levels of management
Tools, Skills & Knowledge
Domain Knowledge
It is challenging to deliver good analytics and associated visualisations without domain knowledge or a procedure that extracts and distils required information instead.
Statistics and Mathematics are used to solve a variety of problems. The aspects listed below exposes a few uses but are in no means exhaustive.
Statistics
The most widely used are Descriptive Statistics, which simplifies and quantitatively describes or summarises features of a collection of information, including central tendency, spread and shape.
Statistical inference assumes an underlying probability distribution that best describes an observed population, enabling one to deduce properties from it.
Mathematics
Linear Algebra
Linear algebra is the mathematics of data. It is used to apply operations6 across matrices (tabular data) and vectors (lists) in parallel.
Factorisation or decomposition simplifies data, including projecting dimensions onto subspaces and reducing dimensions. It allows for for computations to run more efficiently.
Multivariate Calculus
The integral is used to calculate the area under a curve and derive the Probability Density or Cumulative Distribution Functions, as used in parametric statistics and probability theory (distributions).
Derivatives or Jacobians (higher dimension partial derivatives) are used to calculate the gradient descent, the base variant of a widely used optimisation algorithm used to determine the best parameters to minimise the cost of fitting a chosen model to data.
The Taylor/ Power Series is a method for re-expressing functions as a polynomial series. Linear approximations of complex functions simplify the problem, quantifies the influence of predictor variables and enables one to identify anomalies.
Table of resources in relation to Data Science
Process
Programming
Visualisation
| Area | Language | Source | # | Title | Author |
|---|---|---|---|---|---|
| Reference | Python | Web | 1 | matplotlib | Various |
| R | 2 | Geocomputation with R | Robin Lovelace, Jakub Nowosad, Jannes Muenchow | ||
| 3 | ggplot2 | Hadley Wickham, Various | |||
| Training | Python | 4 | Kaggle Learn: Data Visualisation | Aleksey Bilogur | |
| R | Book | 5 | ggplot2: Elegant Graphics for Data Analysis (Use R!) 2nd Edition | Hadley Wickham, Carson Sievert | |
| Web | 6 | Introduction to Data Science with R How to Manipulate, Visualize, and Model Data with the R Language | Garrett Grolemund |
Model
Statistics
Probability
| Area | Language | Source | # | Title | Author |
|---|---|---|---|---|---|
| Reference, Training | Python, Statistics | Web, Book | 1 | Probability for Machine Learning | Jason Brownlee |
| Training | Mathematics | Web | 2 | Statistics 101 | Brandon Foltz |
| 3 | Statistics Foundations 1 | Eddie Davila | |||
| 4 | Statistics Foundations 2 | Eddie Davila | |||
| 5 | Statistics Foundations 3 | Eddie Davila |
Statistics
| Area | Language | Source | # | Title | Author |
|---|---|---|---|---|---|
| Reference | R | Web | 1 | Summary and Analysis of Extension Program Evaluation in R | Salvatore S. Mangiafico |
| Training | Mathematics | 2 | Statistics 101 | Brandon Foltz | |
| 3 | Statistics Foundations 1 | Eddie Davila | |||
| 4 | Statistics Foundations 2 | Eddie Davila | |||
| 5 | Statistics Foundations 3 | Eddie Davila | |||
| Python, R | Web, Book | 6 | Machine Learning Mastery | Jason Brownlee | |
| R | Book | 7 | An Introduction to Statistical Learning with Applications in R | Gareth James, Daniela Witten, Trevor Hastie, Robert Tibshirani | |
| Web | 8 | Statistical Learning | Trevor Hastie, Robert Tibshirani |
Mathematics
Linear Algebra
| Area | Language | Source | # | Title | Author |
|---|---|---|---|---|---|
| Training | Mathematics | Book | 1 | Linear Algebra: Step by Step | Kuldeep Singh |
| Web | 2 | Mathematics for Machine Learning: Linear Algebra | David Dye, Samuel J. Cooper, A. Freddie Page | ||
| 3 | Essence of Linear Algebra | Grant Sanderson |
Calculus
| Area | Language | Source | # | Title | Author |
|---|---|---|---|---|---|
| Training | Mathematics | Web | 1 | Mathematics for Machine Learning: Multivariate Calculus | David Dye, Samuel J. Cooper, A. Freddie Page |
| 2 | Essence of Calculus | Grant Sanderson |
PCA
| Area | Language | Source | # | Title | Author |
|---|---|---|---|---|---|
| Training | Mathematics | Web | 1 | Mathematics for Machine Learning: PCA | Marc P. Deisenroth |
Described in R for Data Science: Exploratory Data Analysis↩︎
A variable is a quantity, quality, or property that you can measure. Height, weight, sex, etc.↩︎
A value is the state of a variable when you measure it. The value of a variable may change from measurement to measurement. 152 cm, 80 kg, female, etc.↩︎
An observation, or data point, is a set of measurements made under similar conditions (you usually make all of the measurements in an observation at the same time and on the same object). An observation will contain several values, each associated with a different variable. Each person.↩︎
Standardisation, Normalisation & Box-Cox transformations for example↩︎
Matrix transformation, inversion, addition and multiplication↩︎